Projects · per project
Build what the platform doesn't do
MyGeotab does a lot out of the box. When you need fleet data in another system, a report built around your own questions, or an AI tool that answers in plain English, we build it.

Example built on Geotab demonstration data. No client data is shown.
Integrations
Connect your fleet data to the rest of the business
Integrations move Geotab data into the systems that need it, so nobody retypes it.
Payroll. Hours and trips feed timesheets and allowances.
Maintenance. Odometer readings, engine hours and fault codes reach your maintenance system without anyone copying them across.
Finance. Vehicle use and fuel data line up with cost centres.
Other systems. Job management, asset registers or whatever else your business runs on.
- Geotab data
- Payroll
- Maintenance
- Finance
- Other systems
Custom dashboards and reports
Dashboards built around your questions
Standard reports answer standard questions. We build dashboards and reports around the questions your managers actually ask, using data from Geotab and, where it helps, from your other systems.


A fleet overview dashboard
A fleet overview a manager can read in a few seconds.
What happens in the recording: A fleet overview dashboard shows vehicles active, distance travelled, idle time by group, after-hours use, the top driving exceptions and a dot map of where trips ended. A filter is changed to one group, a depot, and the figures update. One vehicle is then opened to show its own detail.
Example built on Geotab demonstration data. No client data is shown.
Available now
AI tools you can use now
Three tools are ready to use now: plain-English questions, automated summaries and unusual-activity alerts. Each one runs on your own fleet data, once that data is in good shape.
Plain-English questions
A manager types a question such as “which vehicles idled most last month?” and gets an answer, with the working shown.
Automated summaries
A weekly or monthly written summary of what changed and what needs attention.
Unusual-activity alerts
Flags for after-hours use, fuel anomalies and vehicles behaving differently from the rest of the fleet. We build them once, as a fixed-fee project. Your own staff respond to the alerts.
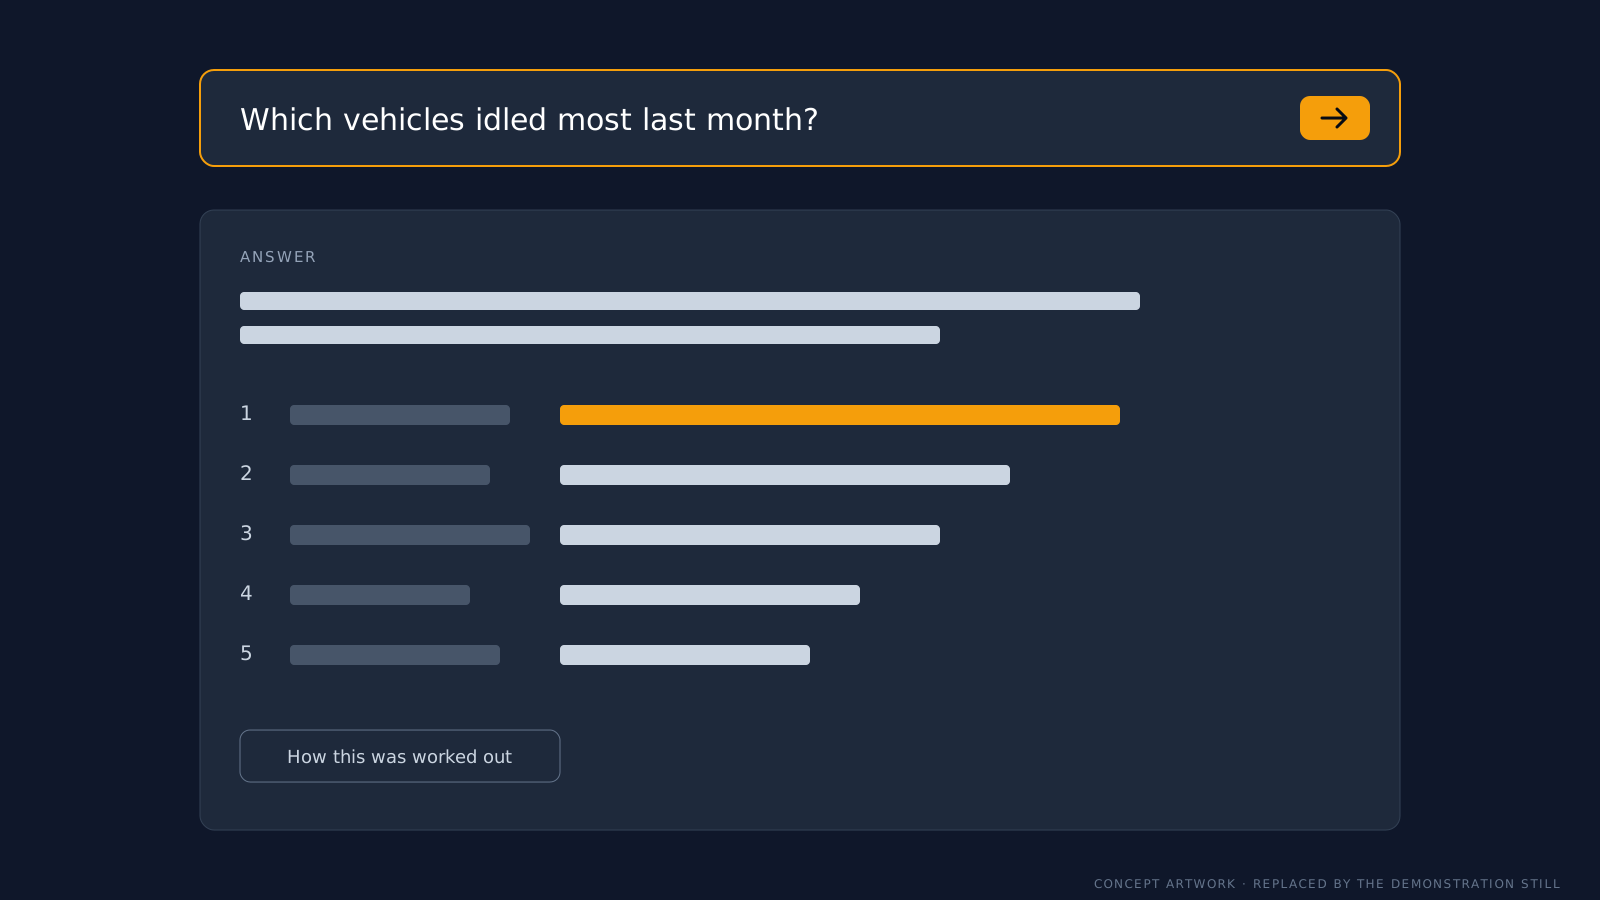
Example on demonstration data
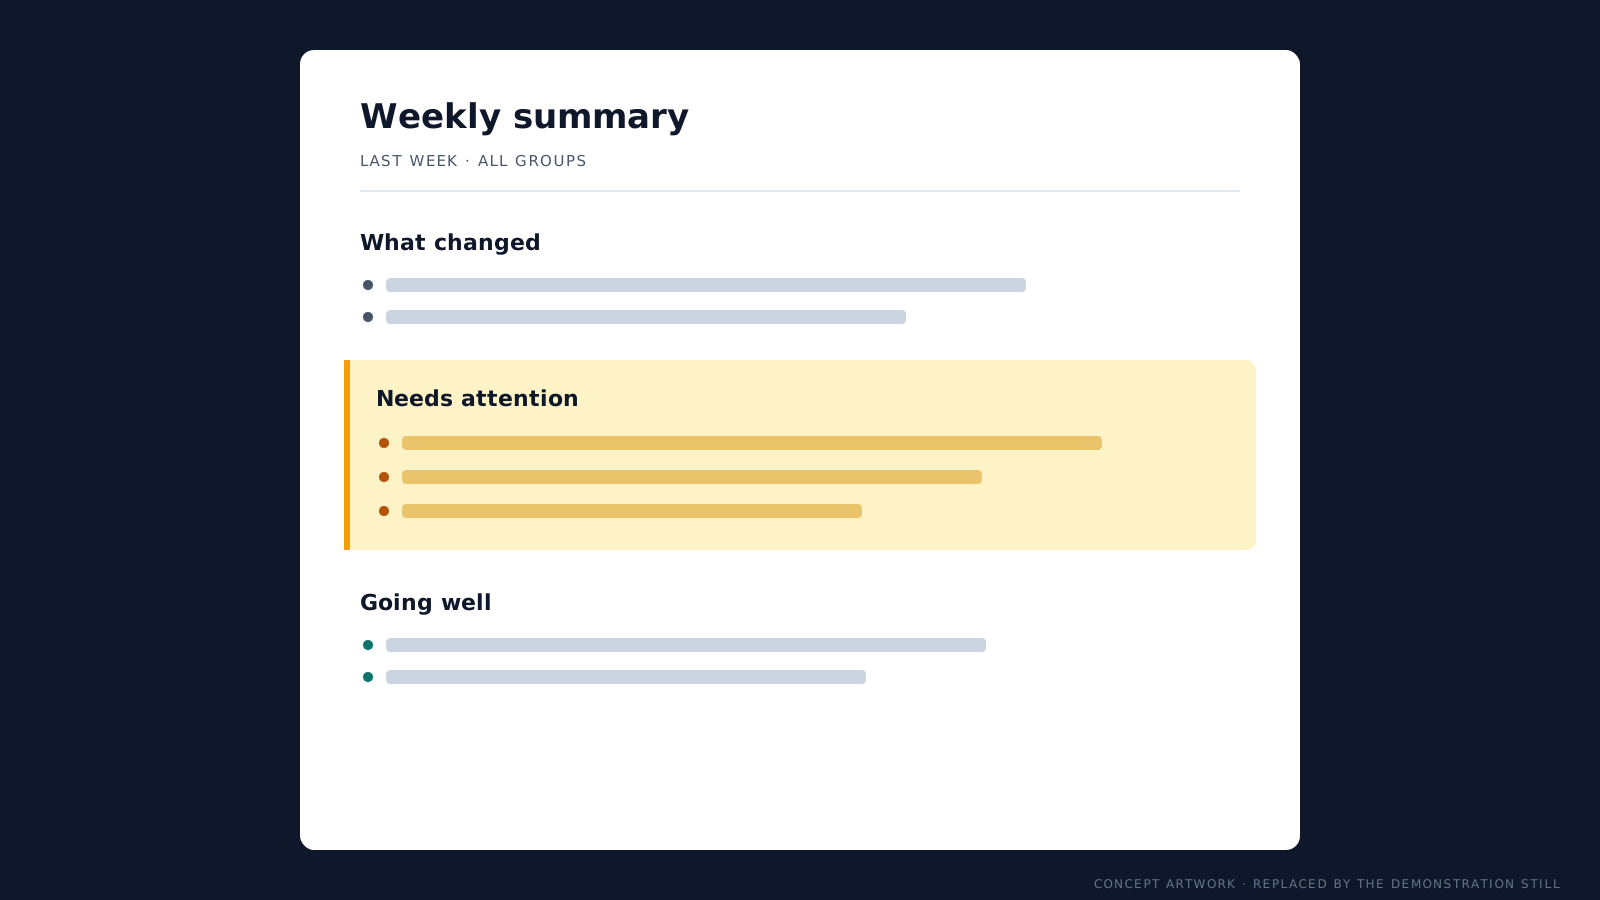
Example on demonstration data
Scoped with you
Predicting maintenance from your own vehicle history
Maintenance prediction is project work that we scope with each client, using your own vehicle history.
It draws on what your fleet has already recorded: odometer readings, engine hours, fault codes and, if we can connect them, your service records. How far it can go depends on how much history you have and how clean it is. We look at that first, then agree with you what the project will deliver before we start.
How it's charged
Fixed scope, agreed before we start
Projects are charged per project. We agree a fixed scope with you before any work starts: what we'll build, what it will do and what you'll get at the end.
Free data health check
Start with a free health check
Projects work best on clean data. The health check shows whether yours is ready, and what to fix first if it isn't. You get a two to three page written report on your top five problems, then a 30-minute call. It's free, and it's not a sales pitch.