
Geotab consultants

The device collects the data. We make it useful.

Most providers fit the devices and leave; we stay after install to set MyGeotab up properly, run it for you and build what it doesn't do.

Book a free health check

A written report on your top five problems, then a 30-minute call.

Watch the demonstrations

Demonstration fleet dashboard showing vehicles active, distance travelled, idle time by group and a dot map of where trips ended

Example built on Geotab demonstration data. No client data is shown.

The usual story

Sound familiar?

  • The devices went in and the installer went quiet. Calls and emails go unanswered.

  • Your reports and your supervisors disagree. The numbers say one thing; the people on the road say another.

  • Alerts fire so often that everyone ignores them. The one that mattered got lost with the rest.

  • The person who understood MyGeotab has left. Nobody else knows how it was set up or why.

  • Fleet data gets retyped by hand. Hours and kilometres go into payroll and maintenance systems one line at a time.

Each of these comes back to how the system was set up and who is looking after it. Both can be fixed.

Hardware is the start

Most providers stop at the install

Every Geotab fleet starts with devices in vehicles. That part usually goes well. Then the system is left on default settings, nobody owns it, and over time the data stops making sense.

The install is where we start. We supply Geotab devices and arrange installation, and we also take on fleets whose devices were fitted by someone else.

  1. Install

    Devices supplied and fitted by installers.

    Where most providers stop
  2. Configure

    Set up so the data is right.

  3. Run

    Looked after month to month.

  4. Build

    What the platform doesn't do.

What we do

Three ways we help after the install

Data and AI, shown working

AI is only as good as the data under it

Ask an AI tool which vehicles idled most last month and it will give you an answer. If half the fleet sits in the wrong group and your own depot shows up as an unknown stop, that answer is wrong, and nothing on screen will tell you.

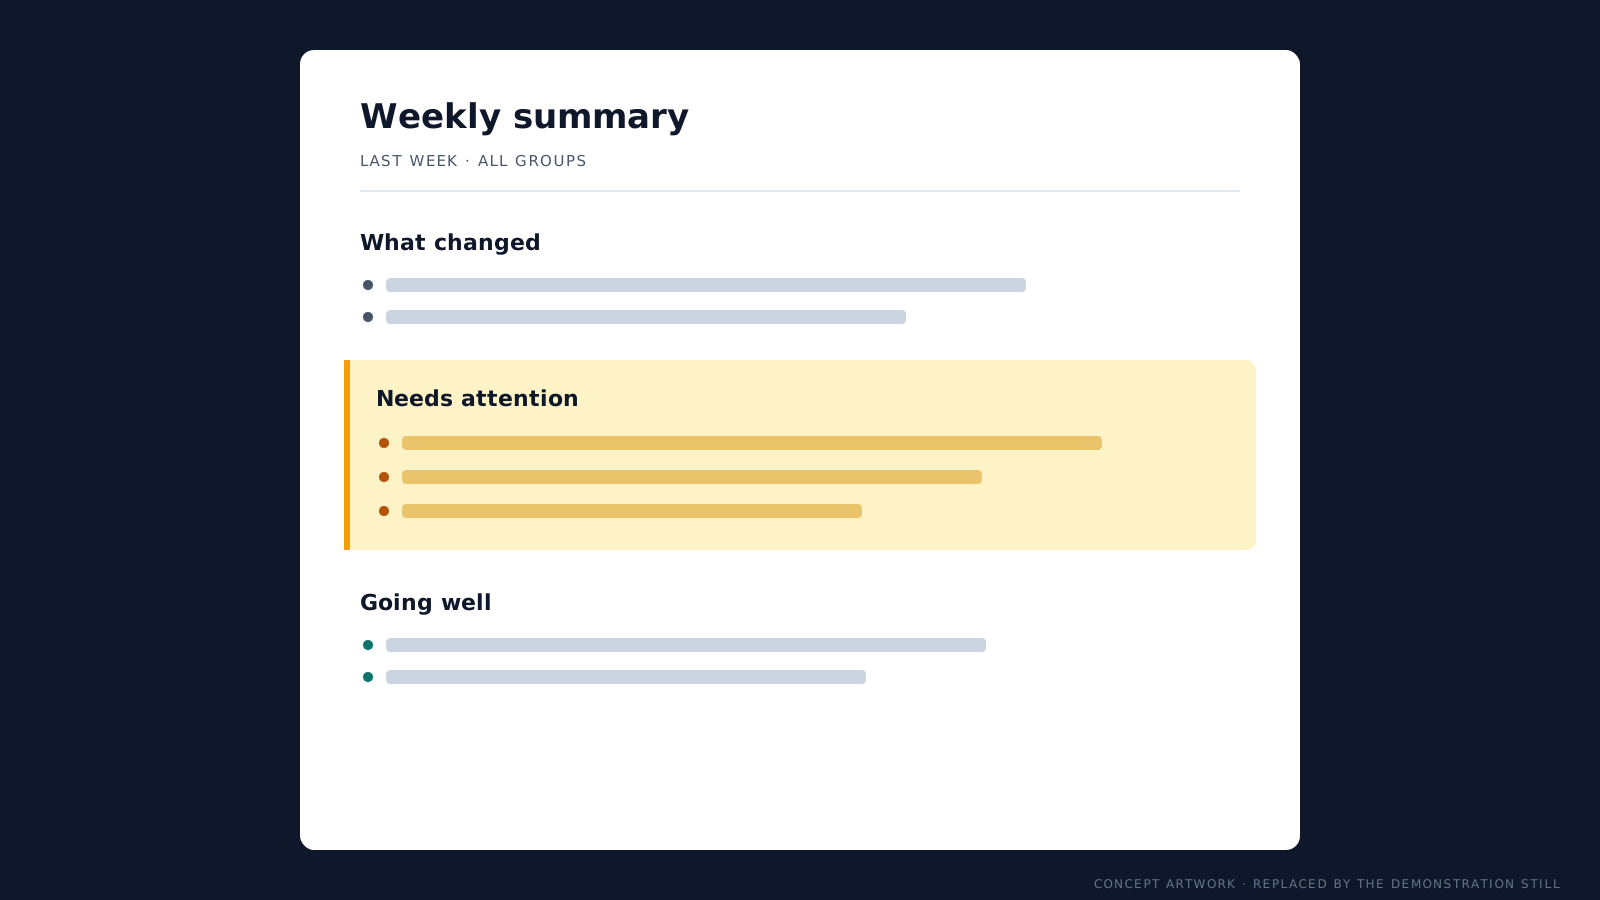
So we get the data right first. Then we put AI to work on it: plain-English questions, automated summaries and alerts for unusual activity.

Geotab's own AI assistant answers questions about your data. We work alongside it, making sure the data it reads is accurate and connecting that data to the rest of your business.

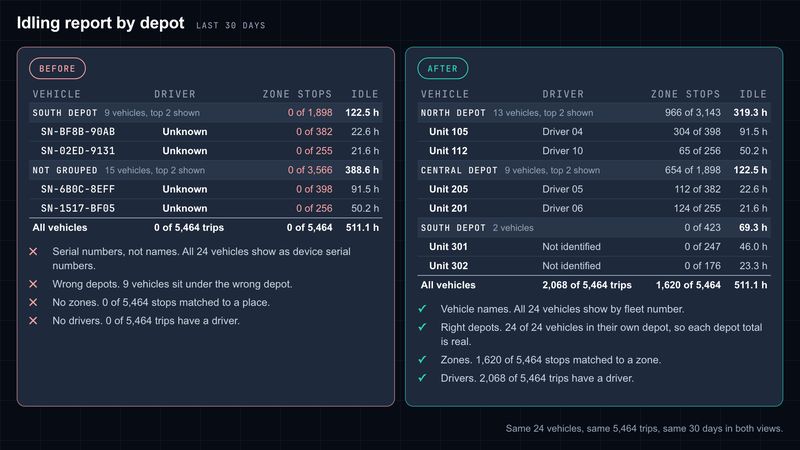
Demonstration of the same idling report side by side, set up badly on the left and properly on the right
Demonstration “before” report: vehicles listed by serial number, wrong depots, no drivers and no stops matched to a zoneDemonstration “after” report: named vehicles in the right depots, with drivers and zone stops shownDemonstration list of the faults fixed: groups, vehicle names, zones and driver identification

Same fleet, set up badly and then set up properly

Same fleet. Same devices. Different answers.

What happens in the recording: An idling report by depot is run on a badly configured set-up. Vehicles show as serial numbers, no stop is matched to a zone, no trip has a driver and the depot totals are in the wrong place. The faults are then fixed: groups, vehicle names, zones and driver identification. The same report is run again on the same data and shows named vehicles in the right depots, with drivers and zone stops.

Example built on Geotab demonstration data. No client data is shown. The “before” view was set up badly on purpose to show common faults.

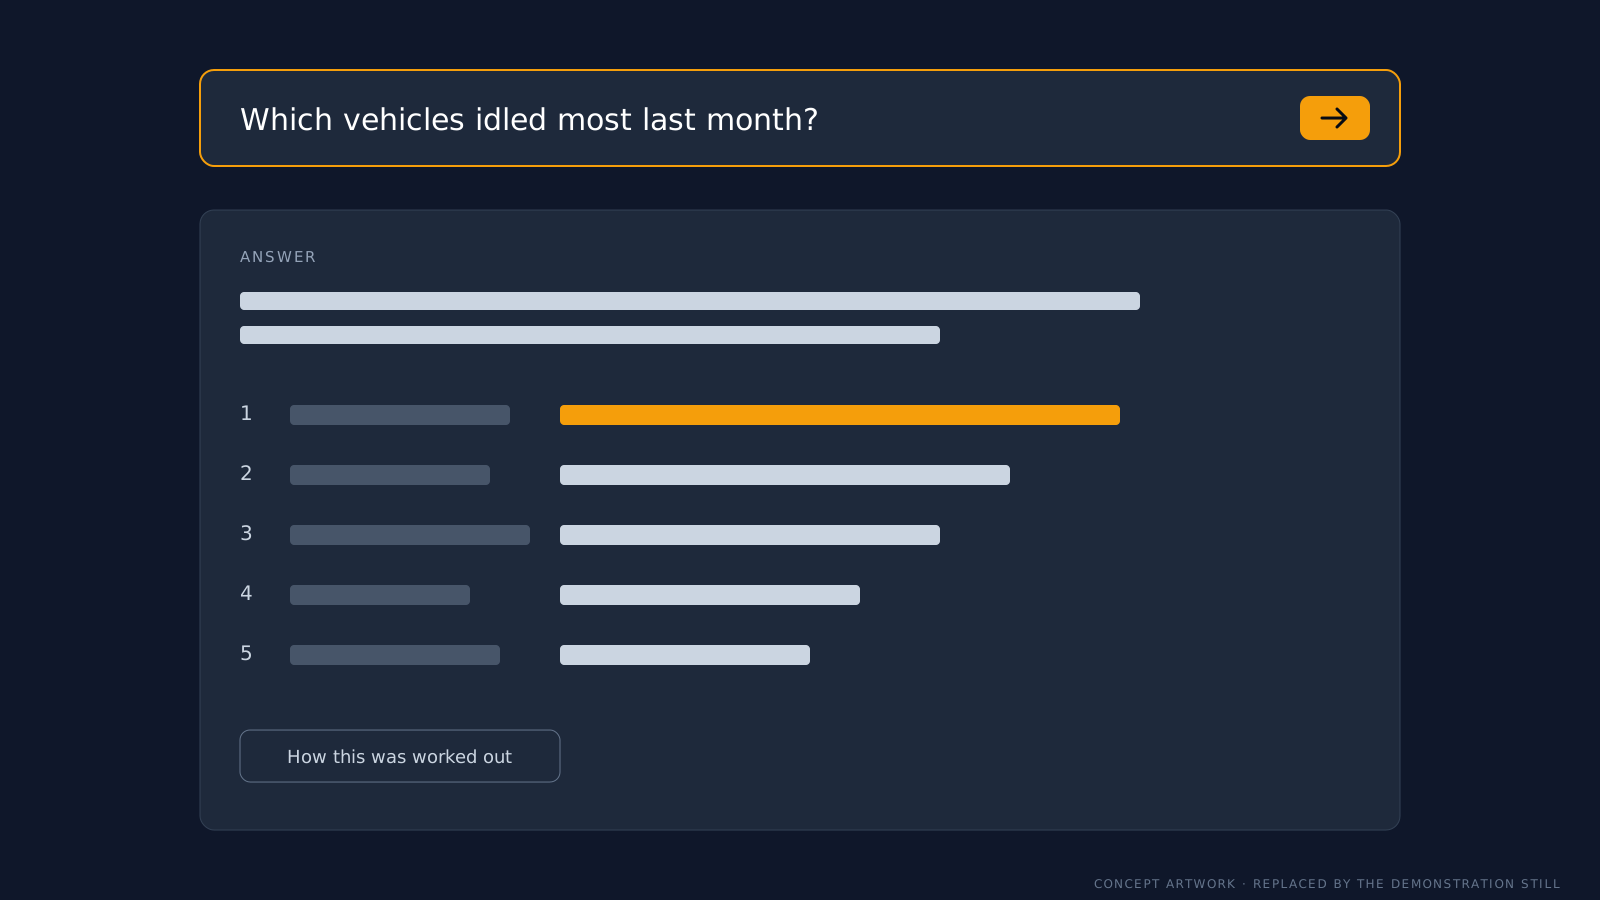
Demonstration answer listing the vehicles with the most idle hours last month

Asking a question in plain English

Ask about your fleet in your own words and get an answer you can trace back to the data.

What the recording will show: A fleet manager types “Which vehicles idled most last month?” A short written answer appears with a ranked list of vehicles and their idle hours. A panel then shows how the answer was worked out: the date range, the vehicle groups included and the data used. A follow-up question narrows the answer to one group.

Example built on Geotab demonstration data. No client data is shown.

How we do it

Clean, connect, analyse, act

  1. Step 01

    Clean

    Fix the set-up so the data is right.

  2. Step 02

    Connect

    Link fleet data to payroll, maintenance, finance and other systems.

  3. Step 03

    Analyse

    Turn it into reports, dashboards and plain-English answers.

  4. Step 04

    Act

    Your team makes decisions on figures it can trust.

The founders

Who you'll work with

Pollex is two people. From the first call on, you deal with the people doing the work.

Andrew Exley, Co-founder

Andrew Exley

Co-founder

Leads data, AI and project builds

Andrew has worked in technology since 1995 and in data and analytics consulting since 2016, most recently leading the data and AI practice at a national technology services firm. At Pollex he builds the dashboards, integrations and AI tools, and he makes sure the data underneath is right before any AI goes near it.

Placeholder silhouette for Chad Polley

Chad Polley

Co-founder

Leads configuration, the monthly service and sales

First contact for health checks

Chad has worked in fleet technology since 2016, including a senior sales and marketing role with a global telematics provider. He leads the configuration work and the monthly MyGeotab service, and he's the first person you'll speak to about a health check.

Free data health check

Find out what's wrong with your data, free

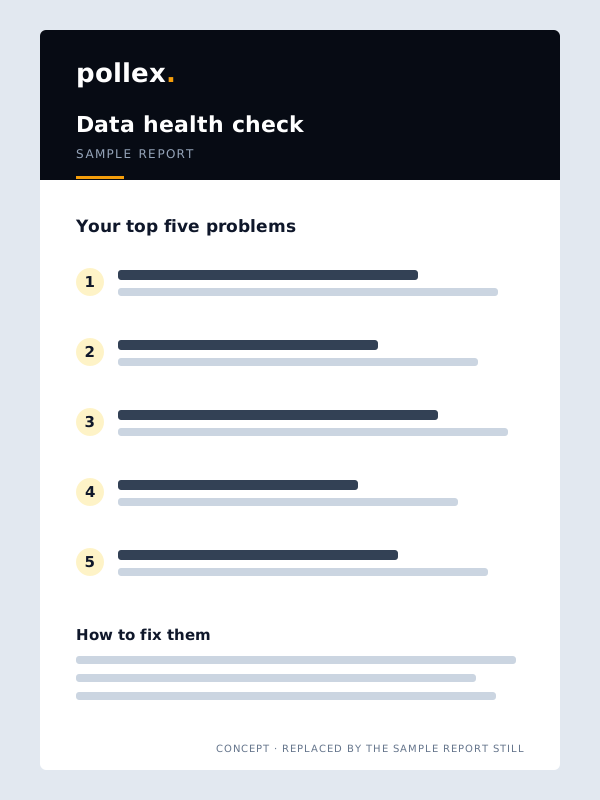
We review your MyGeotab set-up against a fixed scope. You receive a two to three page written report on the top five problems and how to fix them, within ten business days of receiving access. Then we go through it with you on a 30-minute call.

It's free, it's not a sales pitch, and you don't have to buy anything afterwards. It's open to any Australian organisation already using MyGeotab, whoever their provider.

Demonstration health check report page listing the top five set-up problems and how to fix each

A page from a sample health check report.

Example built on Geotab demonstration data. No client data is shown.