Data and AI
Get the data right, then put AI to work
AI built on badly configured data gives wrong answers, and it gives them with confidence. We fix the data first. Then we put AI to work on it.
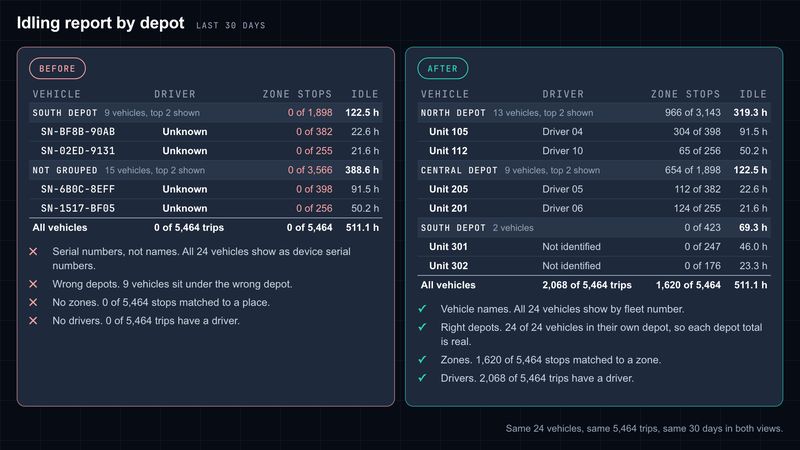
Example built on Geotab demonstration data. No client data is shown. The “before” view was set up badly on purpose to show common faults.
Why the data comes first
Wrong data in, wrong answers out
Most MyGeotab set-ups have faults that nobody notices day to day. Vehicles sit in the wrong groups. Depots and job sites were never drawn as zones, so stops show as unknown. Trips have no driver because driver identification was never set up.
None of this stops the system running. It does mean every report, and every AI answer built on top of it, carries the same mistakes. Ask which depot has the worst idling and you'll get a confident answer about the wrong depot.
- Step 1
Bad set-up
Wrong groups, missing zones, no driver identification.
- Step 2
Wrong data
Unknown stops, trips with no driver, totals in the wrong place.
- Step 3
Wrong result
Every report and AI answer built on it carries the same mistakes.
Alongside Geotab
Working alongside Geotab's assistant
Geotab has its own AI assistant built into MyGeotab. It answers questions about your fleet data.
Our work sits on either side of it. First we make sure the data it reads is accurate. Then we connect that data to the rest of your business: payroll, maintenance, finance and the reports your managers already use. A well-configured database gives Geotab's assistant better material to work from, and our own tools too.
Answers questions about your fleet data
Built into MyGeotab, it handles queries on the data already there.
Keeps the data accurate and connects it
We make sure the data is right and link it to payroll, maintenance, finance and your reports.
The method
Clean, connect, analyse, act
- Step 01
Clean
We fix the set-up: groups, zones, rules, vehicle names and driver identification. Everything after this depends on it.
- Step 02
Connect
We link fleet data to the systems that need it, such as payroll, maintenance and finance, so nobody has to retype it.
- Step 03
Analyse
We turn the data into reports, dashboards, plain-English answers and written summaries that say what changed.
- Step 04
Act
Your team acts on what the data shows. We look at the results with you at each quarterly review.
Demonstrations
See it working
These four demonstrations were built on Geotab's demonstration database, with the same tools and methods we use in our work. No client data is shown. Each recording runs for a minute or less and has no sound, so captions tell the story.
Example built on Geotab demonstration data. No client data is shown.
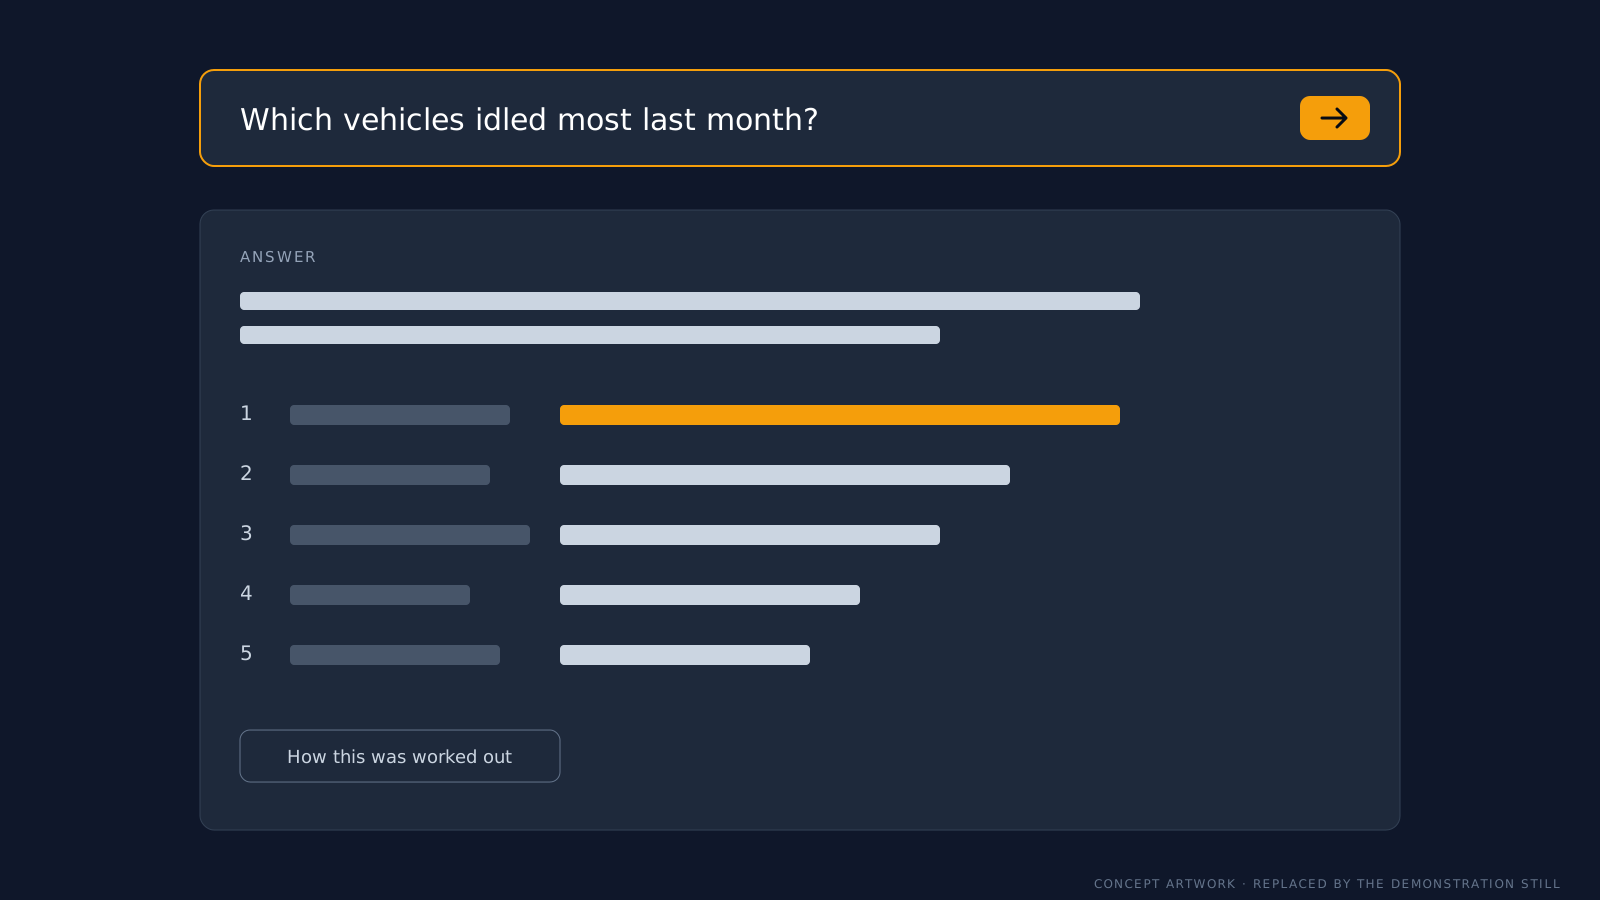
Asking a question in plain English
Ask about your fleet in your own words and get an answer you can trace back to the data.
What the recording will show: A fleet manager types “Which vehicles idled most last month?” A short written answer appears with a ranked list of vehicles and their idle hours. A panel then shows how the answer was worked out: the date range, the vehicle groups included and the data used. A follow-up question narrows the answer to one group.
Example built on Geotab demonstration data. No client data is shown.
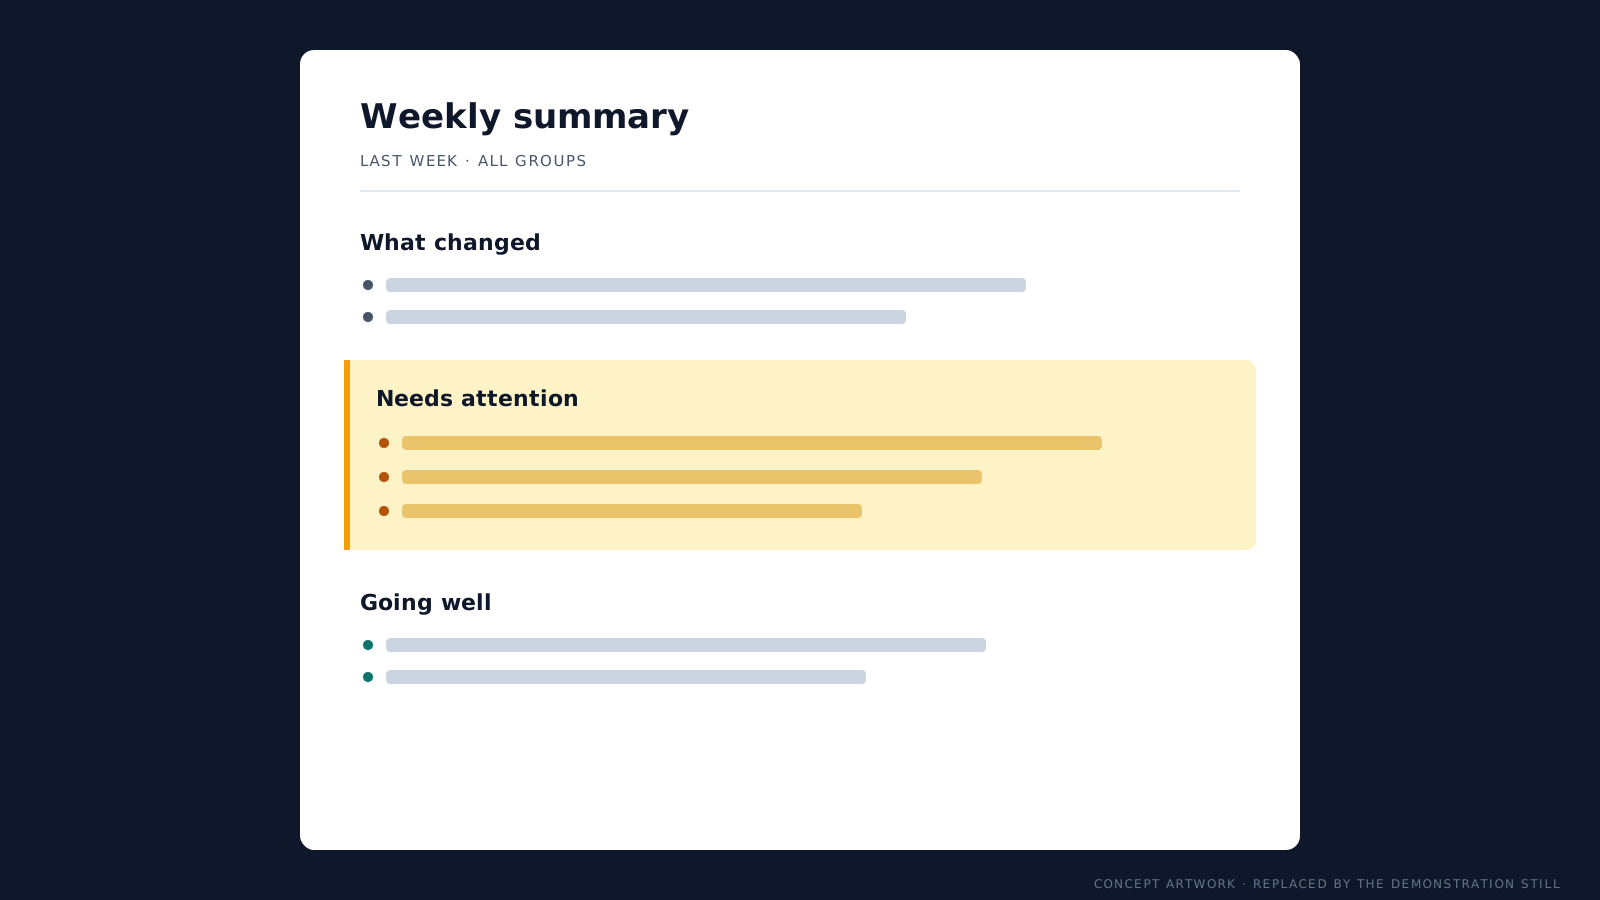
A weekly summary, written for you
Every Monday, a written summary of last week: what changed, what needs attention and what went well.
What the recording will show: Last week's fleet data is gathered and a written summary is produced automatically. It has three headings, What changed, Needs attention and Going well, each with two or three short points. One Needs attention point is then opened to show the vehicles and figures behind it.
Example built on Geotab demonstration data. No client data is shown.


Same fleet, set up badly and then set up properly
Same fleet. Same devices. Different answers.
What happens in the recording: An idling report by depot is run on a badly configured set-up. Vehicles show as serial numbers, no stop is matched to a zone, no trip has a driver and the depot totals are in the wrong place. The faults are then fixed: groups, vehicle names, zones and driver identification. The same report is run again on the same data and shows named vehicles in the right depots, with drivers and zone stops.
Example built on Geotab demonstration data. No client data is shown. The “before” view was set up badly on purpose to show common faults.


A fleet overview dashboard
A fleet overview a manager can read in a few seconds.
What happens in the recording: A fleet overview dashboard shows vehicles active, distance travelled, idle time by group, after-hours use, the top driving exceptions and a dot map of where trips ended. A filter is changed to one group, a depot, and the figures update. One vehicle is then opened to show its own detail.
Example built on Geotab demonstration data. No client data is shown.
Available now
What you can use today
Three AI tools are ready to use now: plain-English questions, automated summaries and unusual-activity alerts.
Plain-English questions
Type a question such as “which vehicles idled most last month?” and get an answer from your own fleet data, with the working shown.
Automated summaries
A weekly or monthly written summary of what changed and what needs attention.
Unusual-activity alerts
Flags for after-hours use, fuel anomalies and vehicles behaving differently from the rest of the fleet. We build them once, as a fixed-fee project, and your own staff respond to the alerts.
Free data health check
Start with a free health check
Before any AI goes near your data, find out how clean it is. We review your MyGeotab set-up and send you a two to three page written report on the top five problems and how to fix them, then go through it on a 30-minute call. It's free, and it's not a sales pitch.